In part one of this application note we looked at basic design concepts and simulation methods for “printed” PCB antennas. In part two we investigated co-simulation of antenna and SMD matching components.
Now in this third part, we will look in more detail at design and simulation of antenna matching networks, and the loss in antenna matching networks.
- Calculate the insertion loss of antenna matching networks correctly
- Optimize power delivered to the antenna, instead of just minimizing reflected power
- Automated synthesis of antenna matching network
This appnote was inspired by Optenni Lab, a powerful matching synthesis software that implements this optimization strategy.
Optimize radiated power, not just minimize reflected
Only for ideal lossless components, minimum reflection from the antenna ensures maximum radiated power. With real components, there is power loss in the matching network itself, and optimizing the return loss does not guarantee increased power delivered to the antenna.
To reach our goal of optimizing the radiated power, we need to consider the loss introduced by the matching network.
Insertion loss, isn’t that trivial? A very simple (but wrong) approach would be to simulate the matching network S21 in a 50 Ohm environment. Don’t do this. The result is invalid (meaningless) because the antenna input impedance might be far off from 50 Ohm. The currents and voltages in the matching network are different when it is loaded with the actual antenna impedance, resulting in different insertion loss. Below we will look at two different correct methods to calculate the actual insertion loss with the antenna load. But first, let’s design two antenna matching testcases that we can compare.
Antenna testcases
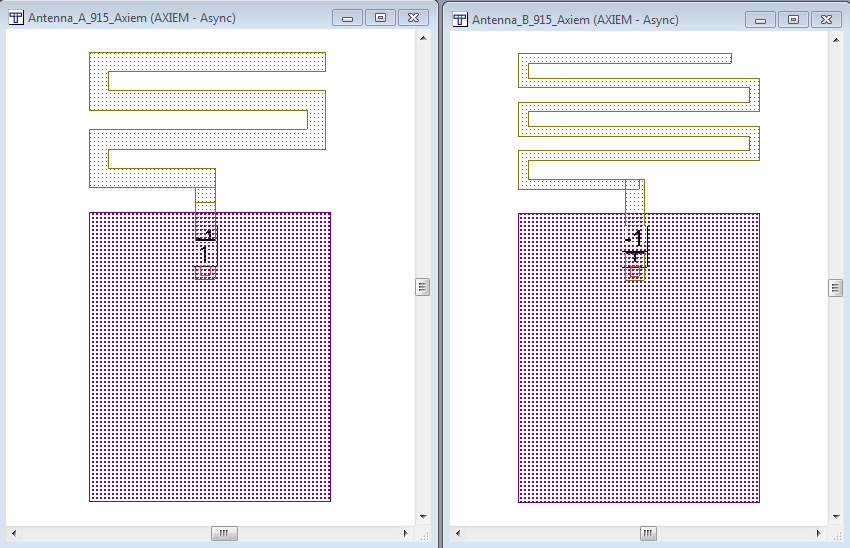
Two meandered metal strips with a ground plane are used as our 915 MHz antenna testcases. These are not the greatest 915MHz antenna designs, but good enough to demonstrate the importance of matching network loss.
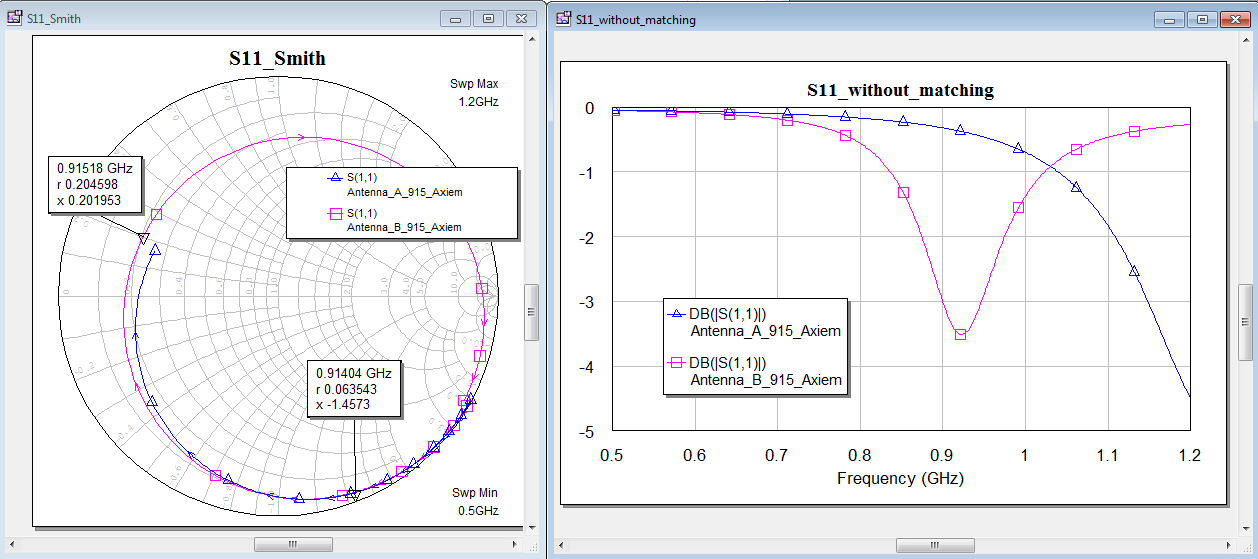
Antenna A is rather short, with a resonance around 1.2GHz. Antenna B is tweaked in length to resonate near the 915MHz target frequency, but with the ground plane so close to the radiator, the input impedance is around 10 Ohm only. Both antennas will be tuned for 915MHz with a matching network.
The matching network was automatically synthesized with Optenni Lab using the Murata component library, but other synthesis software like Nuhertz ZMatch or manual tuning could also be used. For convenience, we will use the values from Optenni.
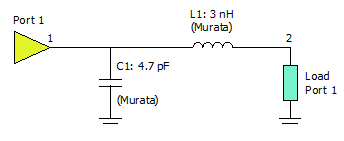
With two components, this is what we get from Optenni Lab as the best matching topology for antenna A:
For antenna B, the best 2-component matching topology is this:
Optenni has already considered the discrete values from the library and the parasitics of each element. If the synthesis is done with other more simplistic tools, we would get continuous, ideal components and would need to iterate manually towards real component values. With Optenni’s library components, synthesis results are already very realistic and include parasitics.
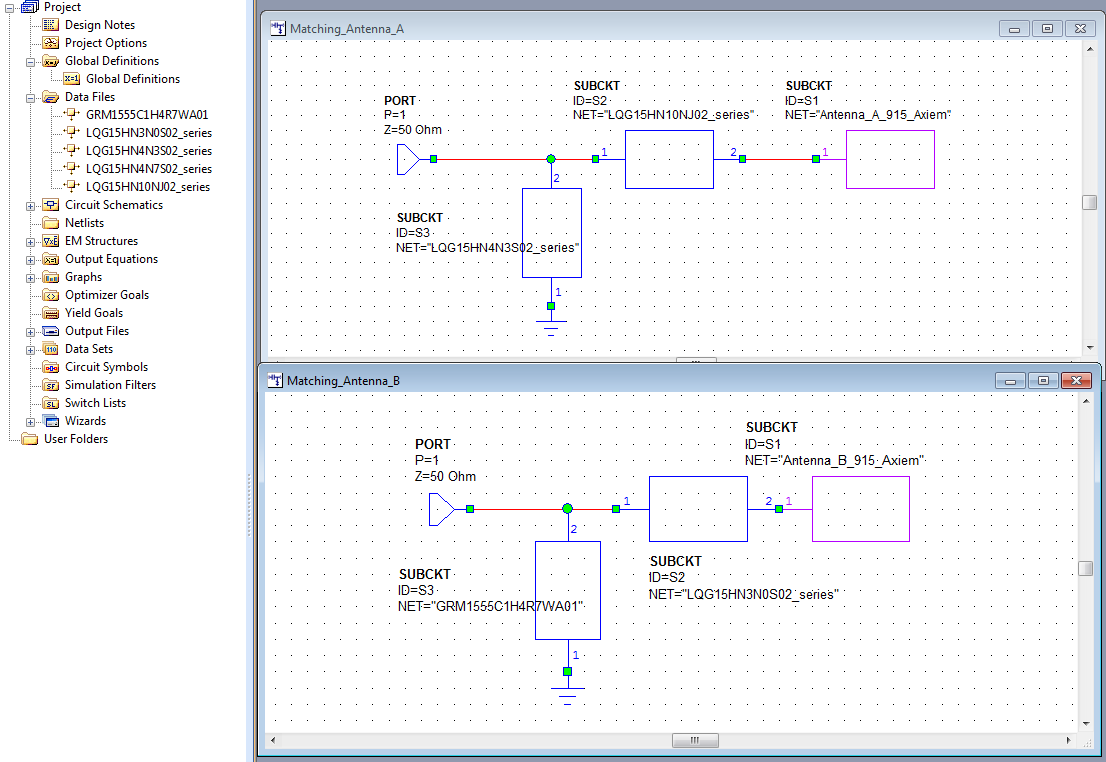
But no matter how we get there, let’s assume we have found some useful component values and now want to manually build the matching network in MWO. To include the parasitics and losses, we use S-parameters from the component manufacturer website or from the MWO component library.
The antenna itself is EM simulated in Axiem as a simple 1-port, with a similar setup as described here. The EM structure impedance terminates the matching network and we can similate the input matching S11 of the matched antenna.
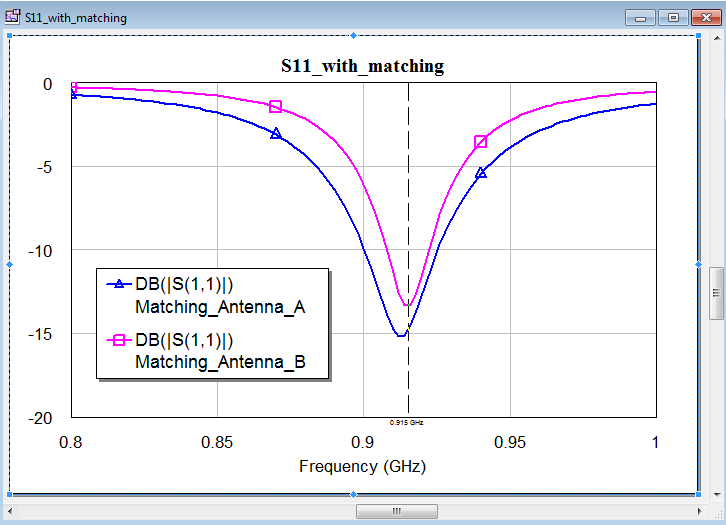
Matching looks fine for both antennas. Antenna A (the short antenna that was initially resonating at 1.2GHz before matching) is a little bit more wideband. Is that good or bad? Which of the two antennas will perform better?
Later in this appnote, we will see that this more wideband matching is actually caused by higher loss in the matching network, and less power is radiated. But here by looking at S11, we can’t differentiate between radiated signal and loss. Can we learn more from the antenna pattern?
Both antennas look almost the same in the 2D antenna pattern (shown above) and in the 3D pattern (not shown). This is because both patterns show the gain = radiated power versus the power accepted by the antenna, and loss in the mathing networks is not included. From S11 and antenna pattern, we don’t know which antenna performs better.
Different from the example shown here, the matching SMDs in this example are completely separate from the EM model and there is no way to directly include them in the MWO antenna gain calculation. We will discuss two ways to simulate the loss in the matching network, which reduces the radiated power.
Loss in matching network (power ratio from non-linear simulation)
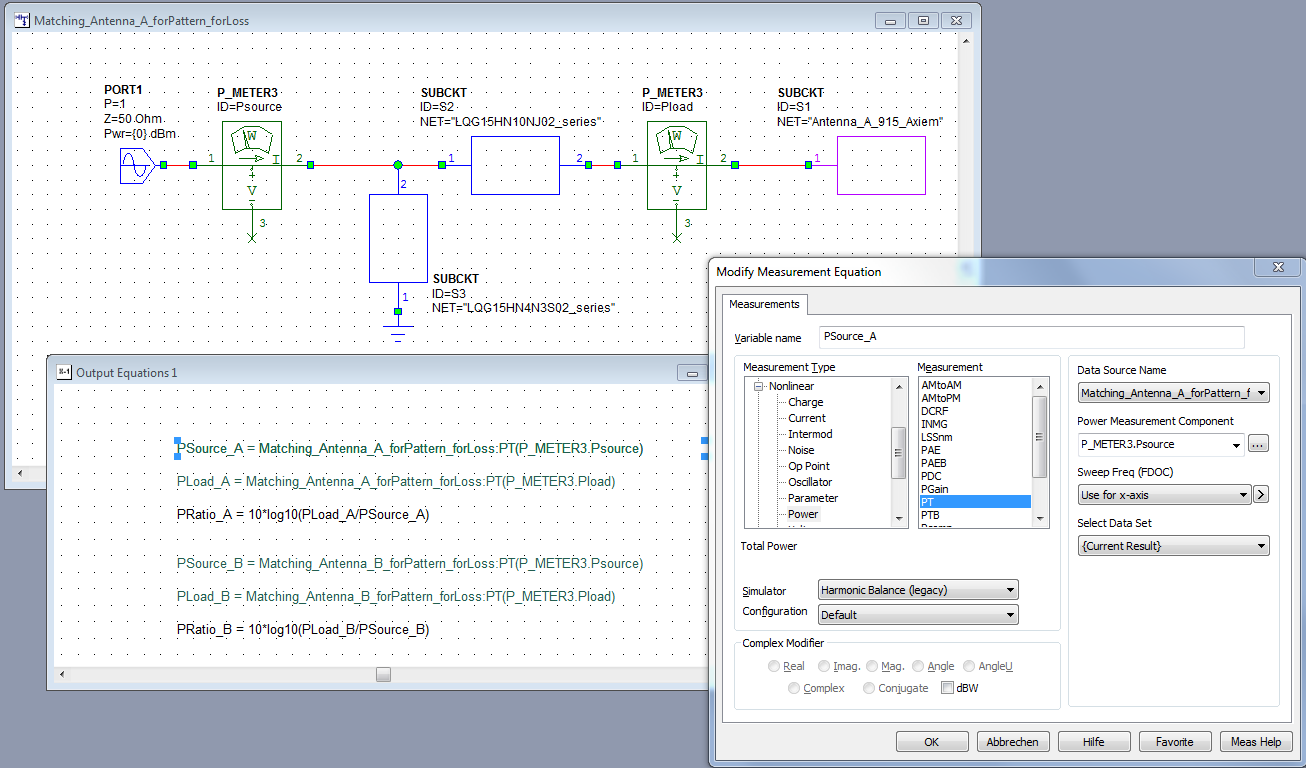
If we already have a non-linear simulation setup to create the 3D antenna pattern, we can use that to measure the power at the input and output of the matching network, and calculate loss from the power ratio. Power measurement is done with P_METER3 elements.
Output Equations are used to calculate the power ratio and provide it in dB() format for plotting. MWO doesn’t know that these values are power, so instead of using the built-in dB() conversion, we use manual 10*log10() math to calculate the dB values.
Loss in matching network (S-parameters with PORT_TN)
To calculate the matching network loss, we can also use linear simulation.
As mentioned earlier in this appnote, using a simple S21 measurement with 50 Ohm ports would not be accurate because the antenna input impedance might be far off from 50 Ohm. But if we use the antenna model for loading the output, we only have a 1-port circuit and can’t measure transmission. How to solve that?
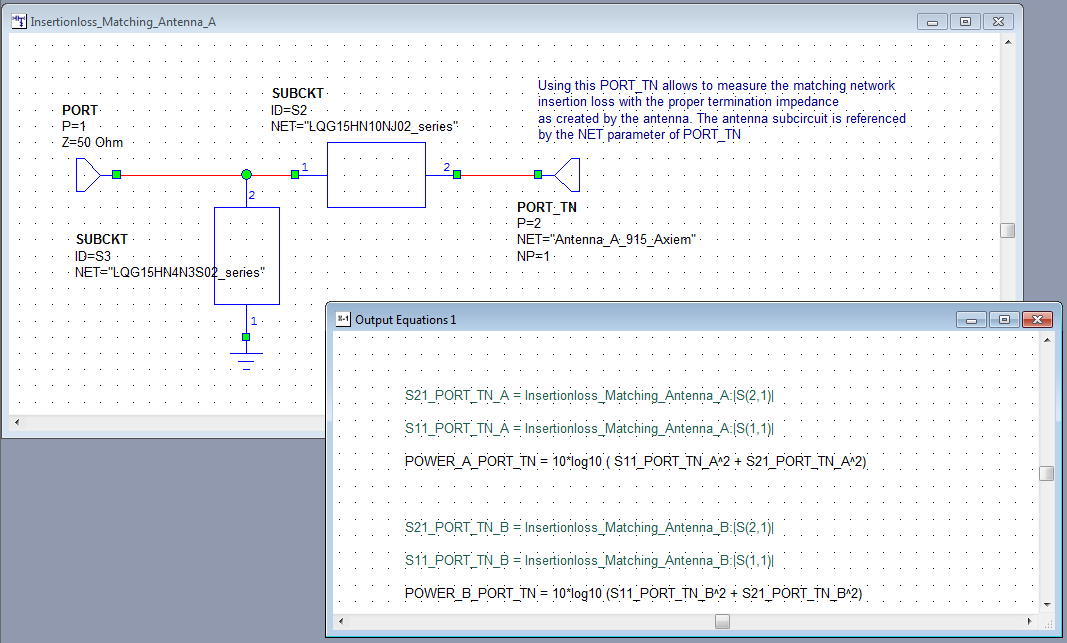
Here is the trick: Instead of using the antenna EM Structure for terminating the matching network, the special port type PORT_TN is used. This references the antenna block and loads the circuit with the antenna impedance, but enables 2-port measurement. This way, we can access the reflected signal as well as the forward signal towards the antenna.
We know that
total power = reflected power + power loss in matching network + power delivered to antenna.
Using that power balance in Output Equations, we calculate reflected power + power delivered to antenna from |S11|^2 and |S21|^2. The difference to total power (0 dB) is then loss in the matching network.
Results, finally
For the antenna A matching network, we get 2.49dB insertion loss from nonlinear simulation and 2.39dB insertion loss from linear simulation. For antenna B, it is 0.25dB and 0.23dB respectively. This means we have about 2.1dB more loss in the antenna A matching network. That shorter antenna requires a more extreme impedance transformation and the resulting matching network is more lossy, compared to antenna B.
This confirms our intuitive understanding that it is better to match the “raw” antenna performance to the operating frequency, rather than trying to fix the impedance in the matching network.
Summary
It was shown that insertion loss simulation of antenna matching networks can’t be done by simply calculating S21 in a 50 Ohm environment. Instead, linear or non-linear power ratio calculations are suggested, with the matching network properly terminated by the actual antenna impedance. With this data, we can then compare antennas and matching networks and optimize for highest radiated power, rather than just minimizing reflection.
Download of the Microwave Office example project:
antenna_915MHz_muehlhaus.zip (131kB)
Acknowledgement: Many thanks to Jaakko Juntunen and Olivier Pelhatre for tips & trick on MWO setup! This appnote would not have been possible without their support.
Antenna matching network synthesis
The matching networks earlier in this appnote where calculated with the Optenni Lab synthesis software. After covering the main topic of this application note – loss in matching networks – let’s have a short look at the synthesis part again.
With automated synthesis, it is very easy to create and compare different matching networks. To optimize the radiated power, Optenni Lab will usually optimize the matching networks for efficiency and not just for return loss. The worst case efficiency at the edges of the target frequency range is displayed along with the matching results and network elements.
The plot above shows the synthesized matching network for the antenna A example from this appnote. In MWO we had simulated the matching network loss as -2.49dB @ 915MHz. Optenni shows the loss over frequency (green curve called “efficiency”) and the worst case result (-3.1dB at the edges of the band, “min efficiency” at the bottom right).
With the synthesis taking just seconds, we can easily compare the performance of different matching topologies. Below is the second best network for antenna A, with -3.9dB worst case loss across the band.
Instead of using continuous ideal elements, a component library was specified, so that only available, realistic elements with parasitics are included in the matching circuit synthesis. This saves much time compared to more simplistic synthesis tools where the synthesized ideal value are only a starting point.


