
IMST has just released Empire XPU version 8.
It looks familiar to Empire users, but there are many user interface improvements which I want to discuss here. Note this is a personal view from a user perspective, not a detailed change list or release notes document.
Project files
Empire 8 uses a new file format (*.emx) and a new directory structure. When working with simulation model abc.emx, Empire creates a separate directory abc for storing all intermediate and result files. This means we can now have multiple *.emx files in the same directory, and Empire will organize all related files in unique directories one level below the *.emx models.
Context menu (right mouse button menu)
Empire now supports what we know from other software: context-dependent choices for the right mouse button menu. This helps a lot to discover all the powerful editing features in Empire, and offers the same features in 2D editor and 3D editor.

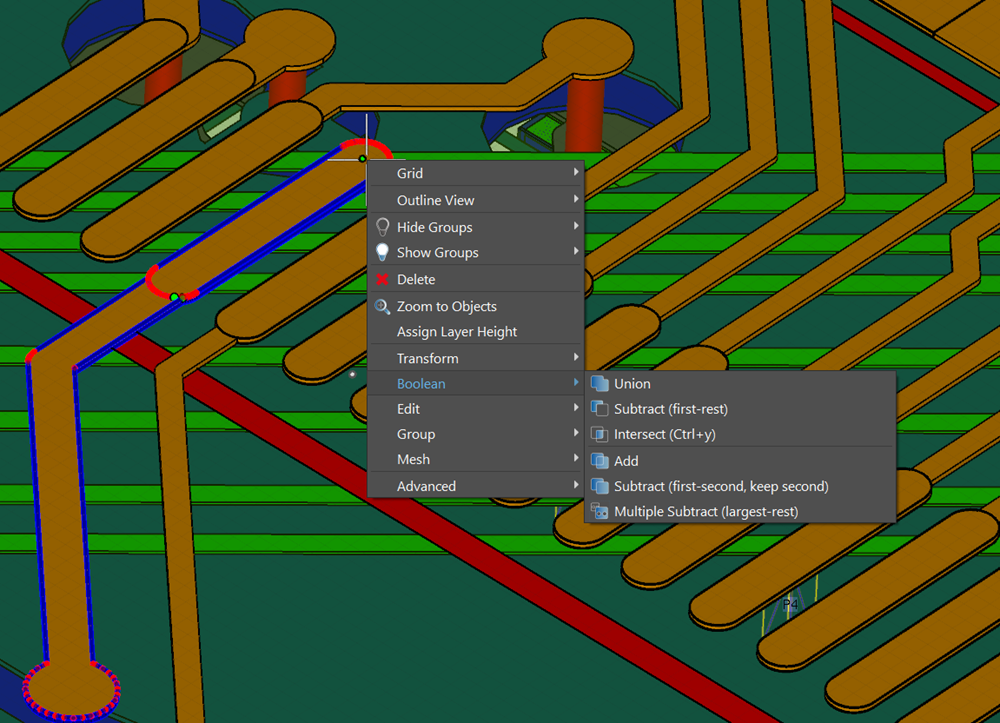
Context menu is not limited to the editors, it can be used in other places as well, for example in the project tree:

Note that “context dependent” also applies for the icon toolbar: some icons like “Setup” have different meaning depending on their context, i.e. Setup in the eidtor configured Editor settings but in the 3D view, it configures 3D view settings and in the Simulation setup, it configures simulation settings.
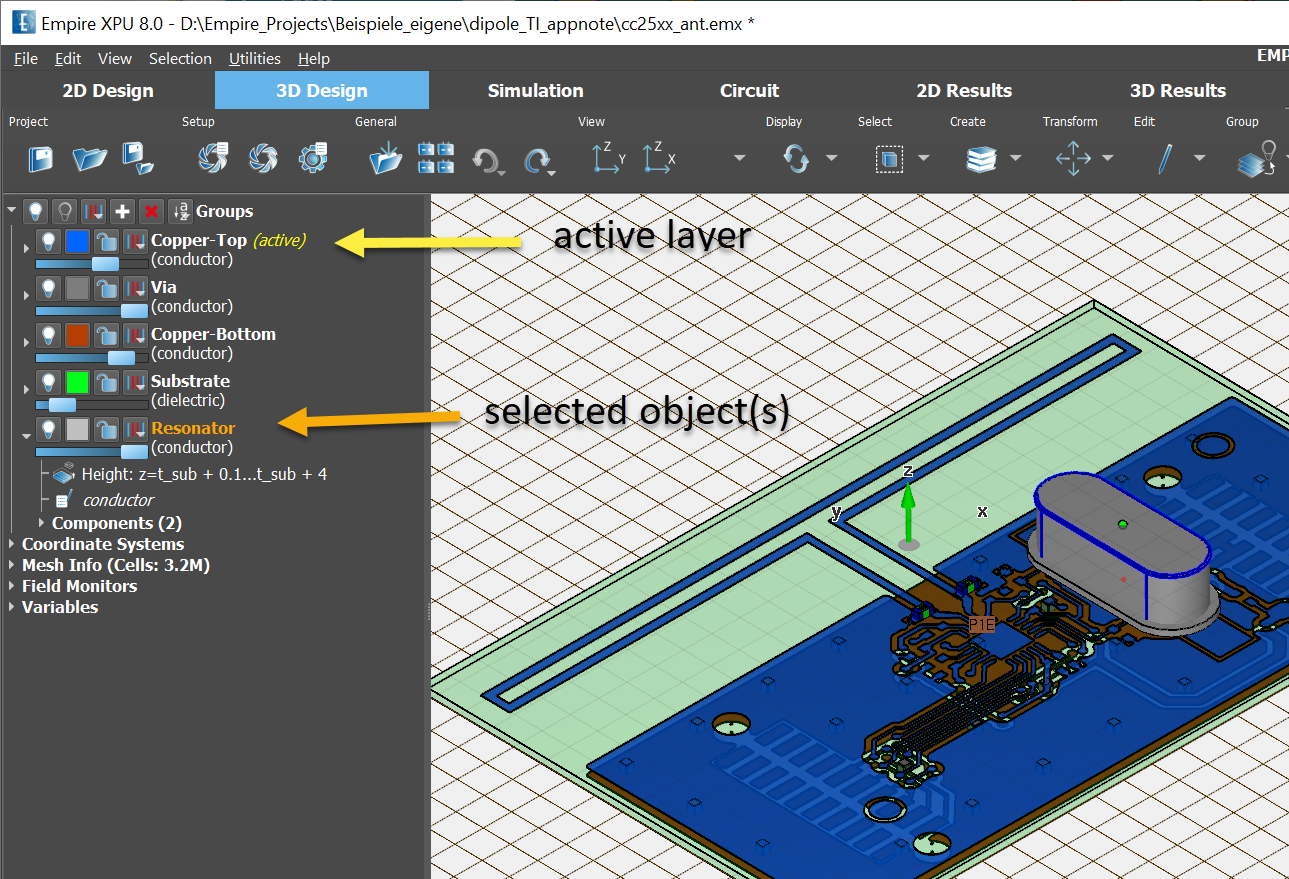
Project Tree
The project tree was re-organized, for more intuitive use. It supports drag&drop to move objects or properties between groups.
Important changes:
- To change the active input group (layer), select it and choose “Set Active” from the context menu.
- Highlighted layers indicate the group (layer) of selected objects.
Creating an object with exact coordinates
In the past, it was sometimes difficult to draw an object at the precise coordinates with the precise numbers, so some users just drawed “something” and then edited the coordinates in the project tree. Now with Empire 8, it is much easier to assign precise coordinates.
Objects are created as before, but then a new dialog is shown where you can see – and possibly edit – all values.
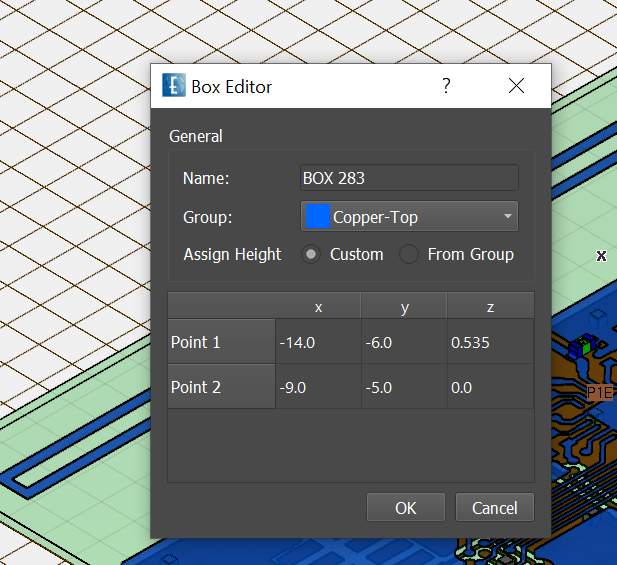
Note the “Group” and “Assign Height”settings: the preset for the group is the currently active group, but you can change that from the dialog. You can also choose if the height value is inherited from the group, or a custom value is used.
This height choice is particulary important in the 3D editor: it usually snaps the input height to the topmost object underneath the cursor, but here you can force the group (layer) position and height instead. This makes it much easier to edit multi-layer layouts in the 3D editor now.
The dialog will remember your last choice. My favorite mistake here: I forget to switch this back to “from group”, after using “custom” height. So please double check these settings when creating objects.
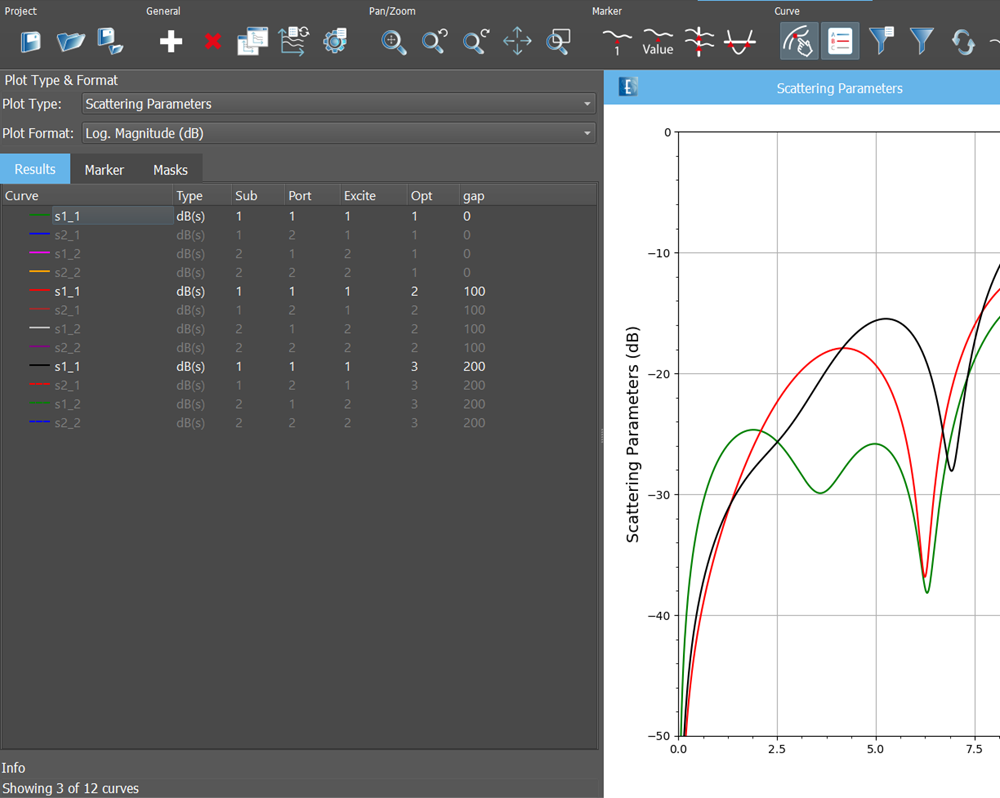
Results Viewer
The 2D results viewer was completely redesigned.
Using tabs (1) you can now switch between different 2D views easily. When you start, there is only one tab with 2D results, but more tabs can be added using the + icon from the toolbar (2).
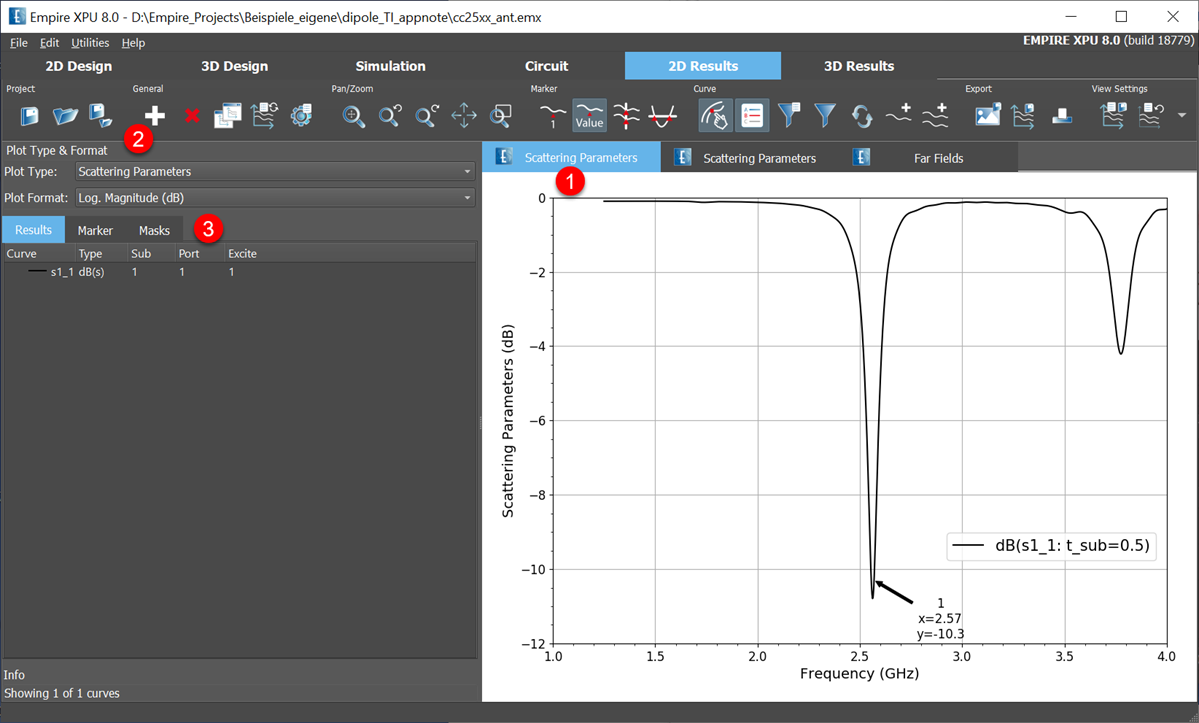
Each results plot is configured (3) using the tabs “Results”, “Marker” and “Masks”.
To choose what data is included in the plot, we now have two choices: the classic list of results or a tree view, which shows the file tree in the results folder.
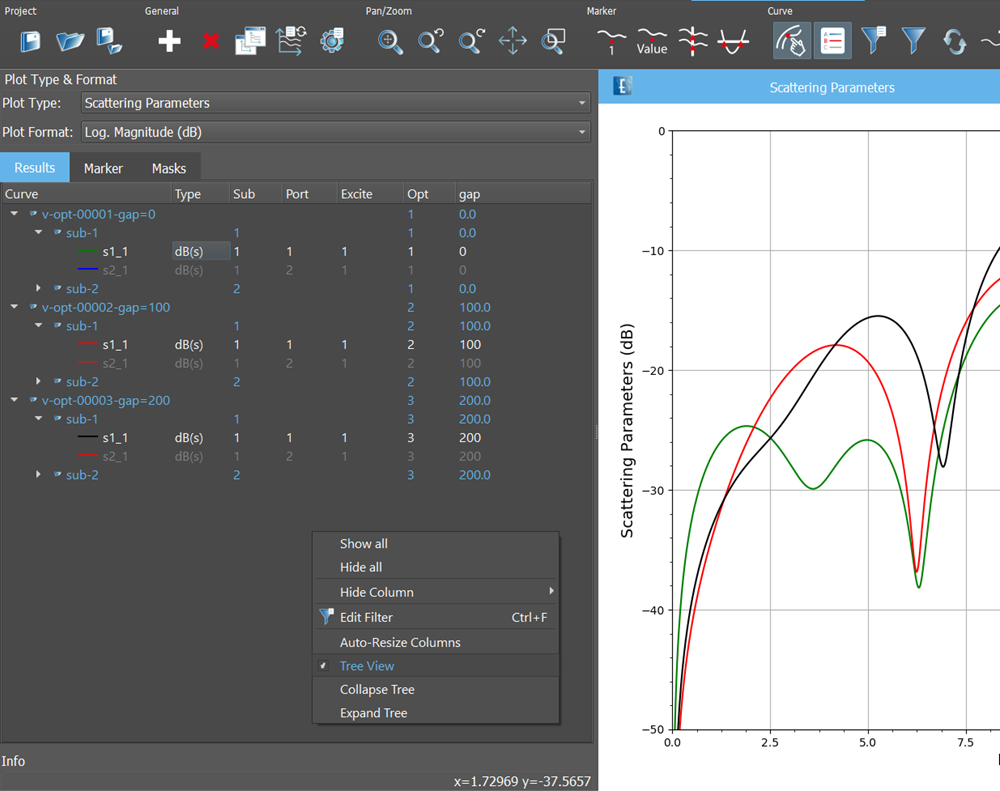
The classic list is shown below. In the right mouse button context menu, you can find a nice “Edit Filter” option that allows you to filter the data to be plotted.
Masks is a new feature, to add user defined limit lines to the plot. Different mask types can be configured, for range or upper or lower limit. You can even define complicated limit lines with many data points (not shown here).

To configure the plot details and settings like font sizes and curve names in the legend, use “Configure Plot” from the right mouse button context menu.
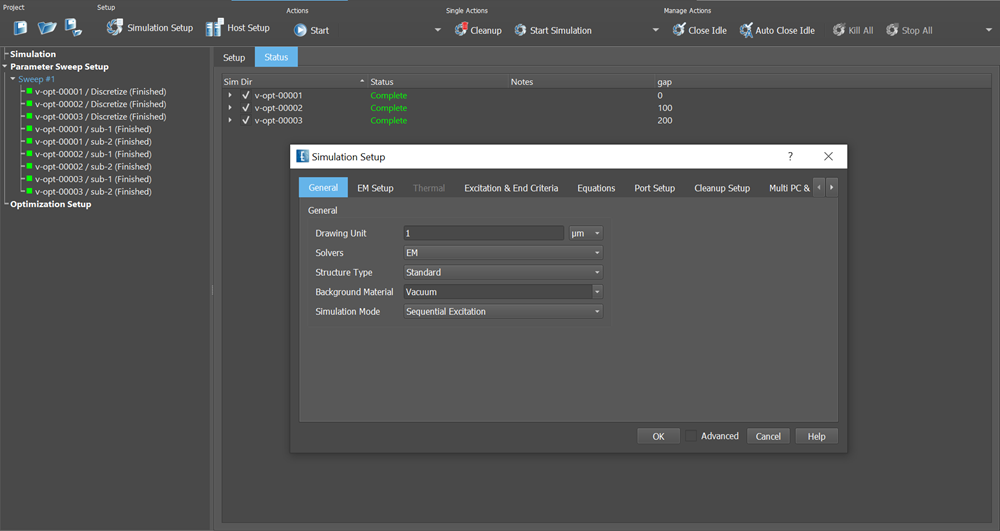
Simulation Control
There is an all-new simulation control window, which I don’t want to discuss here because it is intuitive. Note the right mouse button local menu items also.
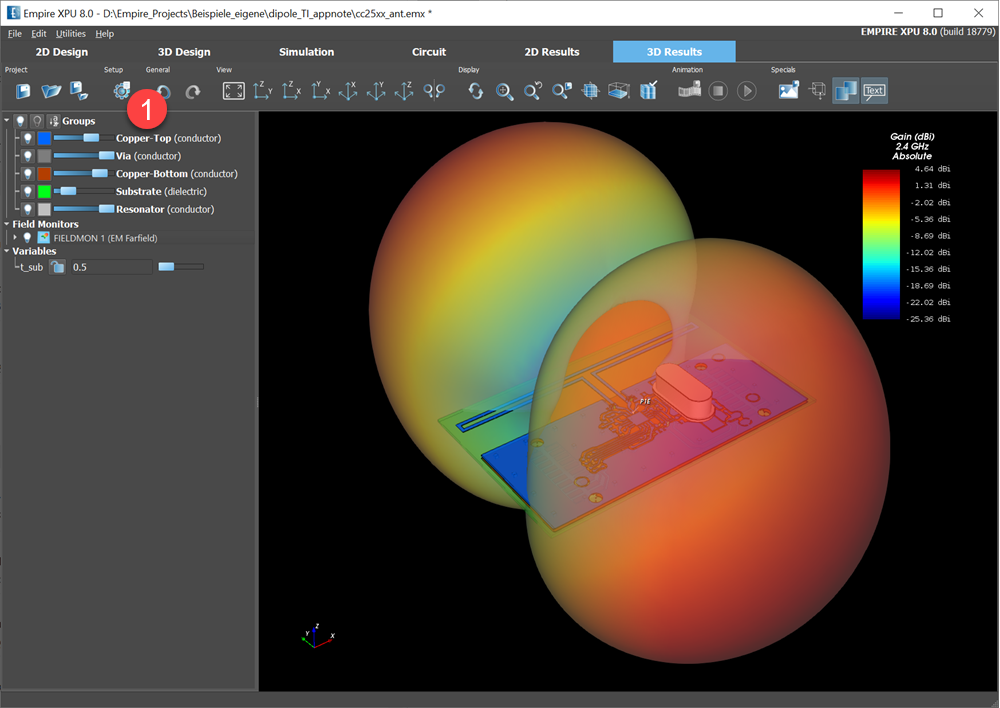
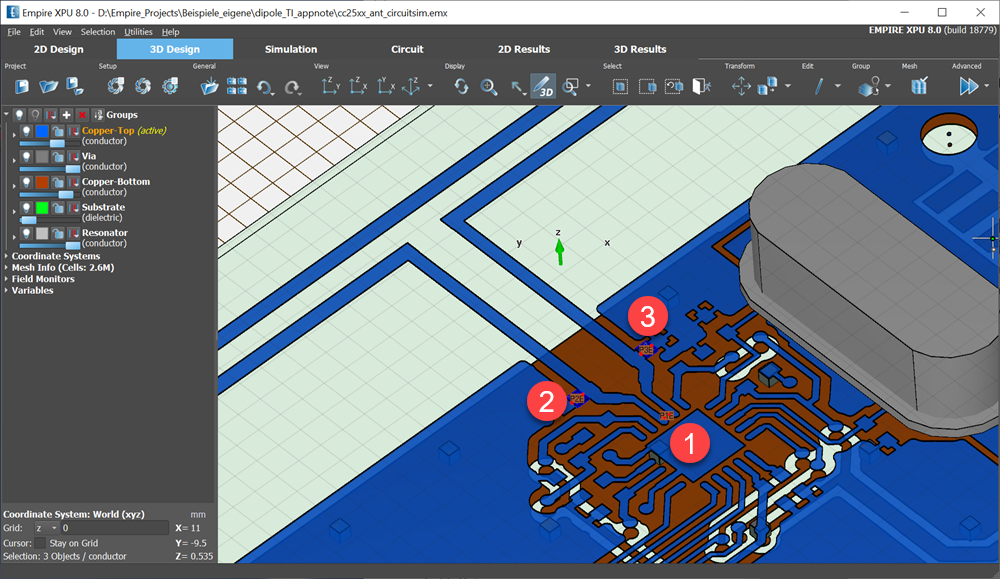
3D Viewer and Antenna Pattern
For antenna pattern, the new graphics library used in Empire 8 provides much higher quality plots.
To configure visual settings, use the Setup icon from the toolbar. To change the legend size, just drag it using the mouse.
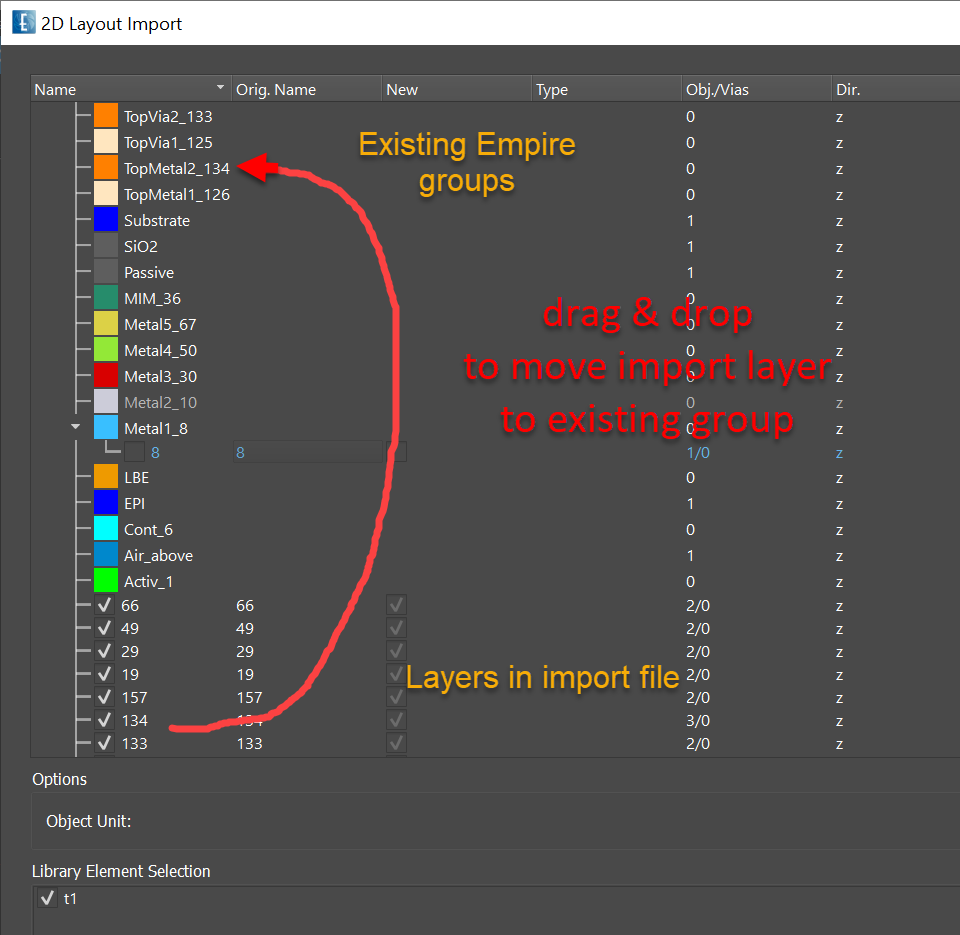
Geometry import
Layer assignment in geometry import was re-designed, and now uses drag & drop to assign layers from the input file to existing Empire groups.
These mappings can then be saved to a layer mapping file, or loaded from a layer mapping file.
Circuit simulation
The optional circuit simulation feature (license required) was re-designed completely, and can now be found on the “Circuit” tab.
Below is an antenna example with three EM ports, where port 1 is the input port into the antenna and ports 2 and 3 are shunt capacitors. The value of these shunt capacitors can now be changed in circuit simulation, without re-simulating the EM part. Only a quick circuit simulation is needed.
As you can see, we have separate variable lists for the EM model (1) where parameter changes require a new EM simulation and for circuit simulation (2) where value changes changes can done without repeating the EM simulation.
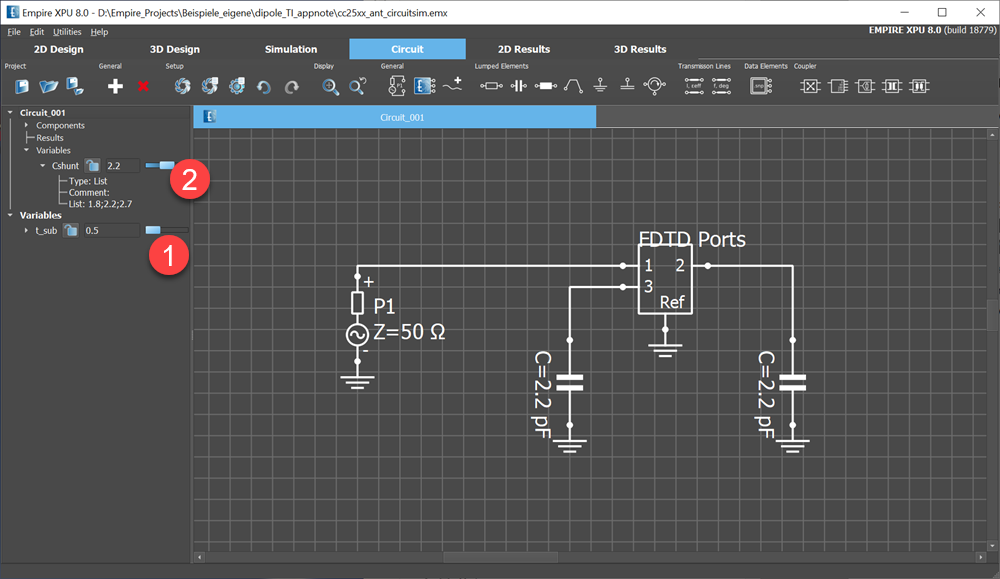
Circuit simulation can be configured to calculate Y/Z parameters, 2-port noise calculation etc. It also includes an an experimental feature for far field superposition, based on excitation from circuit simulation.
To use circuit simulation, license feature EMP_CS is required.